Ironman Software Forums
Continue the conversion on the Ironman Software forums. Chat with over 1000 users about PowerShell, PowerShell Universal, and PowerShell Pro Tools.
 Discuss this Article
In this blog post, we will look at how to build a custom server monitoring solution using PowerShell Universal and InfluxDB.
The goals of our monitoring solution will include:
The first step to building a server performance monitoring system is to collect data that we wish to use within the system. In this example, we will use CPU time, memory usage, disk time, network utilization, and disk space.
Collecting this type of information on a Windows system is relatively straightforward using the Get-Counter and Get-CimInstance cmdlets. Below are some examples of how to collect various performance metrics.
Collect the percentage of processor time that is currently being used with PowerShell.
$PerformanceStat = '\Processor(_Total)\% Processor Time'

$Value = 0
(Get-Counter $PerformanceStat).CounterSamples | ForEach-Object {
    $Value += $_.CookedValue
}
Collect the current percentage of committed bytes in use with PowerShell.
$PerformanceStat = '\memory\% committed bytes in use'

$Value = 0
(Get-Counter $PerformanceStat).CounterSamples | ForEach-Object {
    $Value += $_.CookedValue
}
Collect the current percentage of disk time being used with PowerShell.
$PerformanceStat = '\physicaldisk(_total)\% disk time'

$Value = 0
(Get-Counter $PerformanceStat).CounterSamples | ForEach-Object {
    $Value += $_.CookedValue
}
Collect the current network utilization with PowerShell.
$BytesReceived = 0
(Get-Counter '\network adapter(*)\bytes received/sec').CounterSamples | ForEach-Object {
    $BytesReceived += $_.CookedValue
}

$BytesSent = 0
(Get-Counter '\network adapter(*)\bytes sent/sec').CounterSamples | ForEach-Object {
    $BytesSent += $_.CookedValue
}
Now that we have a way to collect performance data, we can look at how to store that data on a schedule into InfluxDB.
InfluxDB is a time series database that is perfectly suited for this type of data storage. In this example, we are using the open-source version. You can download the ZIP file for Windows and start the influxd.exe to get the database up and running. There are a variety of other ways to run InfluxDB but this is an easy way to get started on Windows.
Once you have InfluxDB running, you can connect to it with the InfluxDB Shell (influx.exe) and create a new database for our performance data.
CREATE DATABASE performance_data
SHOW DATABASES
With our database created, we can begin storing data using the InfluxDB REST API. The REST API makes it very easy to integrate with PowerShell. To store an individual measurement in InfluxDB, you can send an Invoke-RestMethod call to the REST API.
This example stores the percent disk time into the counter measurement with the host and counter tags and the value field. The host and counter tags are indexed and can be queried quickly. Fields are not indexed.
$Value = 0
(Get-Counter '\physicaldisk(_total)\% disk time').CounterSamples | ForEach-Object {
    $Value += $_.CookedValue
}

Invoke-RestMethod -Method POST -Uri $InfluxUrl -Body "counter,host=$ENV:COMPUTERNAME,counter=$($PerformanceStat.Replace(' ', '\ ')) value=$value"
Now that data is stored in the database, you will be able to query it in the InfluxDB Shell using a SQL-like syntax.
USE performance_data
SELECT * FROM counter
To integrate such a script into PowerShell Universal, you will want to click Automation \ Scripts and add a new script. Our script will store all the counters listed above into various measurements within InfluxDB. A time stamp is also provided so that all the measurements are stored at the same time even though they will come into the database at slightly different times.
$TimeStamp = [DateTimeOffset]::Now.ToUnixTimeMilliseconds() * 1000000

$PerformanceStats = @(
    '\Processor(_Total)\% Processor Time'
    '\memory\% committed bytes in use'
    '\physicaldisk(_total)\% disk time'
)

$NetworkStats = @(
    '\network adapter(*)\bytes received/sec'
    '\network adapter(*)\bytes sent/sec'
)

foreach($PerformanceStat in $PerformanceStats) {
    $Value = 0
    (Get-Counter $PerformanceStat).CounterSamples | ForEach-Object {
        $Value += $_.CookedValue
    }

    Invoke-RestMethod -Method POST -Uri $InfluxUrl -Body "counter,host=$ENV:COMPUTERNAME,counter=$($PerformanceStat.Replace(' ', '\ ')) value=$value $TimeStamp"
}

foreach($PerformanceStat in $NetworkStats) {
    $Value = 0
    (Get-Counter $PerformanceStat).CounterSamples | ForEach-Object {
        $Value += $_.CookedValue
    }

    Invoke-RestMethod -Method POST -Uri $InfluxUrl -Body "network,host=$ENV:COMPUTERNAME,counter=$($PerformanceStat.Replace(' ', '\ ')) value=$value $TimeStamp"
}


Get-CimInstance -ClassName Win32_LogicalDisk | ForEach-Object {
    $FreeSpace = $_.FreeSpace
    $UsedSpace = $_.Size - $_.FreeSpace

    Invoke-RestMethod -Method POST -Uri $InfluxUrl -Body "disk,host=$ENV:COMPUTERNAME,device_id=$($_.DeviceID) free_space=$FreeSpace,used_space=$UsedSpace $TimeStamp"
}
To schedule the script in PowerShell Universal, you can either edit the schedules.ps1 file in the repository or add a new schedule in the UI. For the purpose of this example, we will use a Continuous schedule. This type of schedule will run over and over again with a configurable delay between each run. This example runs every 15 seconds.
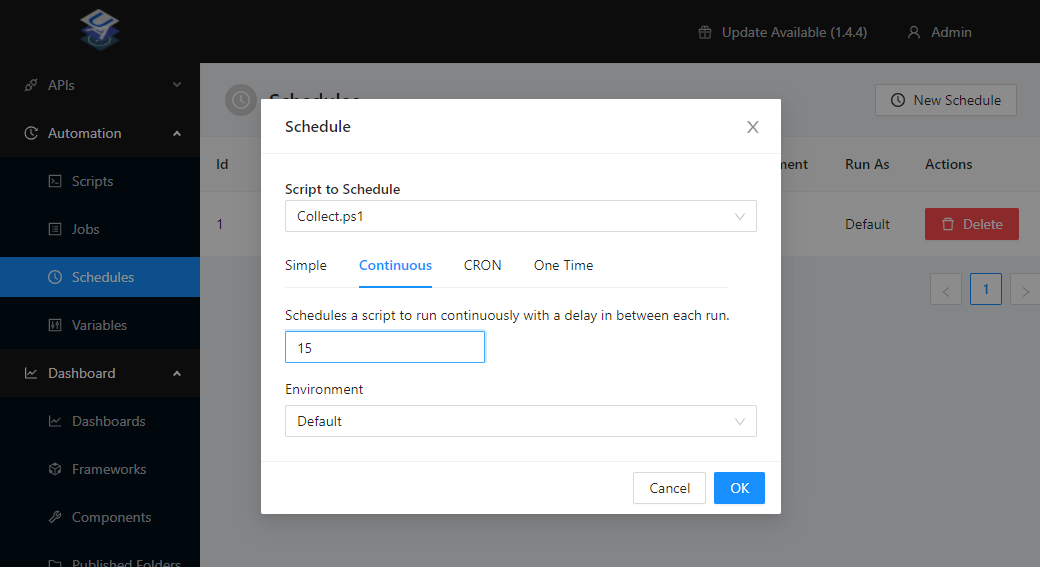
Note that the free version of PowerShell Universal can run up to 25 jos per day.
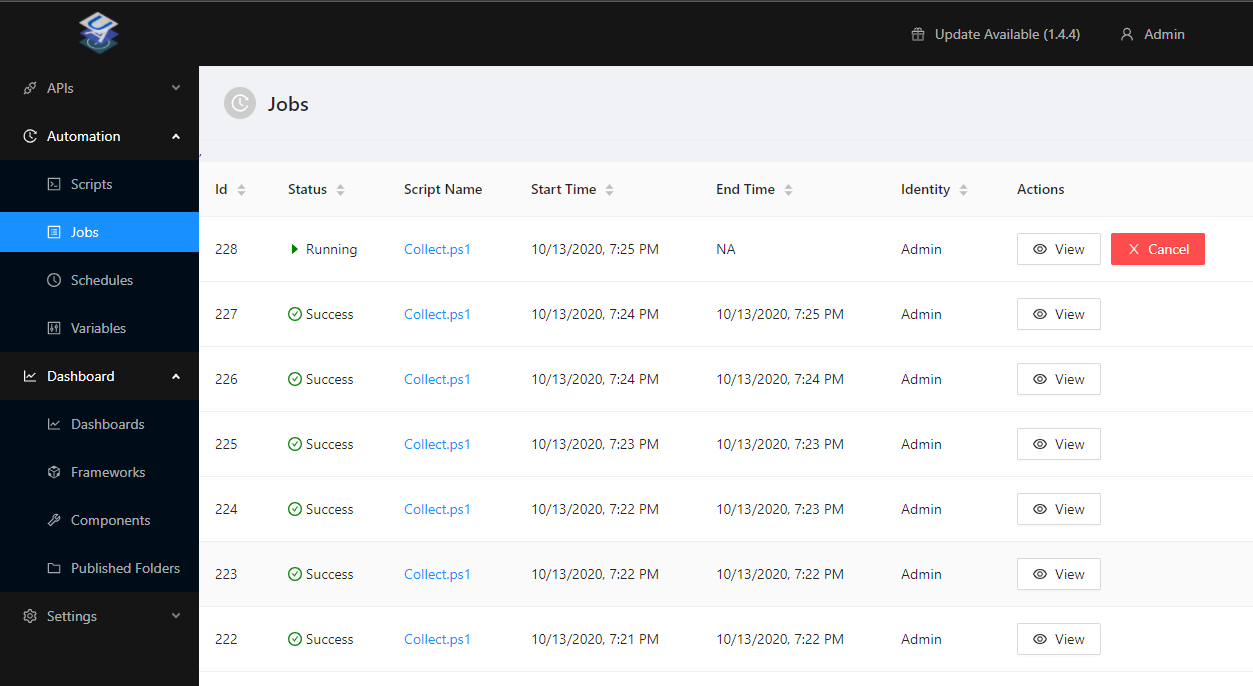
Now that the schedule has been created, you will see that jobs will begin running over and over again.
You will also see that the InfluxDB server will be filling with the server’s performance data.
InfluxDB shell version: 1.8.3
> use performance_data
Using database performance_data
> select * from counter
name: counter
time                counter                             host            value
----                -------                             ----            -----
1602612658638857300 \Processor(_Total)\% Processor Time LAPTOP-496LAUK8 8.86267222641405
1602613286861000000 \Processor(_Total)\% Processor Time LAPTOP-496LAUK8 17.8473960507057
1602613286861000000 \memory\% committed bytes in use    LAPTOP-496LAUK8 80.0098034506686
1602613286861000000 \physicaldisk(_total)\% disk time   LAPTOP-496LAUK8 2.81640458236621
1602613404570000000 \Processor(_Total)\% Processor Time LAPTOP-496LAUK8 9.15761295450475
1602613404570000000 \memory\% committed bytes in use    LAPTOP-496LAUK8 79.9051481950807
1602613404570000000 \physicaldisk(_total)\% disk time   LAPTOP-496LAUK8 2.0182171800194
1602613427678000000 \Processor(_Total)\% Processor Time LAPTOP-496LAUK8 8.54146267380193
1602613427678000000 \memory\% committed bytes in use    LAPTOP-496LAUK8 79.9332273145982
1602613427678000000 \physicaldisk(_total)\% disk time   LAPTOP-496LAUK8 2.06497953425292
1602613450511000000 \Processor(_Total)\% Processor Time LAPTOP-496LAUK8 21.4134164253569
1602613450511000000 \memory\% committed bytes in use    LAPTOP-496LAUK8 79.9848103616351
1602613450511000000 \physicaldisk(_total)\% disk time   LAPTOP-496LAUK8 2.09811405433319
1602613473535000000 \Processor(_Total)\% Processor Time LAPTOP-496LAUK8 6.77267590101716
1602613473535000000 \memory\% committed bytes in use    LAPTOP-496LAUK8 79.8988505685466
1602613473535000000 \physicaldisk(_total)\% disk time   LAPTOP-496LAUK8 2.01757810664928
1602613496469000000 \Processor(_Total)\% Processor Time LAPTOP-496LAUK8 11.9849525886149
Now that we have a script that runs on an interval, we can also configure some notifications for when certain thresholds are hit. In this example, we’ll setup a Slack notification that gets posted when one of our metrics reaches greater than 75%.
First, you’ll need to configure an incoming webhook and set it up to post to a particular channel.
Once configured, you’ll have a URL that you can post messages to Slack. Let’s add the URL as a secret to PowerShell Universal. Click the Automation \ Variables and Add Variable button. Select the Secret tab and enter the URL as a string secret. This will be stored securely in Windows so we do not need to keep it within our script.
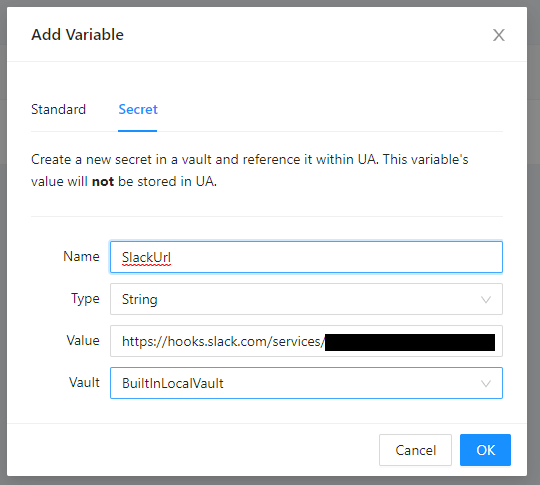
With our variable configured, we can now setup our Collect.ps1 script to send a Slack message.
foreach($PerformanceStat in $PerformanceStats) {
    $Value = 0
    (Get-Counter $PerformanceStat).CounterSamples | ForEach-Object {
        $Value += $_.CookedValue
    }

    if ($Value -gt 75)
    {
        Invoke-RestMethod -Uri $SlackUrl -Method Post -Body (@{ text = "$PerformanceStat has exceeded 75% with $Value" } | ConvertTo-Json)
    }

    Invoke-RestMethod -Method POST -Uri $InfluxUrl -Body "counter,host=$ENV:COMPUTERNAME,counter=$($PerformanceStat.Replace(' ', '\ ')) value=$value $TimeStamp"
}
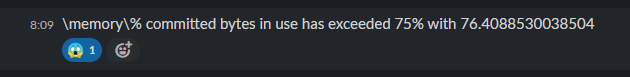
When the script runs, you will now be notified (quite frequently) that thresholds are being exceeded.
Now that we have data being inserted into the InfluxDB database, we can use that data to create a dashboard within PowerShell Universal. This dashboard will consist of two charts and a table. The charts will show the performance data and the network data. The table will show the disk free space.
First, create a new dashboard within the Dashboard \ Dashboards page. We are using the Universal Dashboard v3 framework and running on PowerShell 7 for this example.
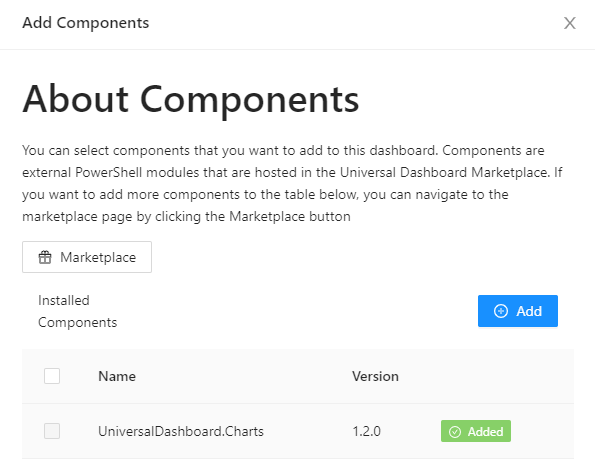
Next, we need to add the Charts component to the dashboard. Click the info button on the Dashboards page and then the Components button on the Dashboard page to add the chart component.
With the charts component library added, we can begin to create our dashboard. For this example, we will use the New-UDGridLayout control to create the layout using a drag and drop designer. The grid layout enables a design mode that will automatically store the layout as JSON in the clipboard.
Our basic dashboard should start out like this. It will include the grid layout and three cards; one for each chart and table.
New-UDDashboard -Title 'Performance Data' -Content {

    New-UDGridLayout -Content {
        New-UDCard -Id 'networkData' -Title 'Network Data' -Content {
        }

        New-UDCard -Id 'performanceData' -Title 'Performance Data' -Content {
        }

        New-UDCard -Id 'diskData' -Title 'Disk Data' -Content {
        }
    } -Design
}
With these cards added and the -Design parameter set on New-UDGridLayout, you will be able to view the dashboard and drag and drop the components.
The resulting layout will be stored in the clipboard as JSON like this.
{"lg":[{"w":5,"h":4,"x":3,"y":0,"i":"grid-element-networkData","moved":false,"static":false},{"w":5,"h":4,"x":3,"y":4,"i":"grid-element-performanceData","moved":false,"static":false},{"w":5,"h":3,"x":3,"y":8,"i":"grid-element-diskData","moved":false,"static":false}]}
Now that we have the basics, let’s collect data from InfluxDB. We can do this through the InfluxDB REST API. Here is a function that retrieves data from the performance_data table and that formats the data in a way that is easier to consume in PowerShell.
function Get-InfluxDB {
    param(
        [Parameter()]
        $Url = 'http://localhost:8086/query?db=performance_data',
        [Parameter()]
        $Query
    )

    $Results = Invoke-RestMethod -Uri "$Url&q=$Query"

    foreach($series in $results.results.series) {

        $ResultSeries = @{
            Fields = @()
        }

        foreach($tag in $series.tags.PSObject.Properties) {
            $ResultSeries[$tag.Name] = $Tag.Value
        }

        $Columns = $series.columns
        foreach($value in $series.values) {
            $Result = @{}
            for($i = 0; $i -lt $Columns.Length; $i++) {

                if ($Columns[$i] -eq 'time') {
                    $result.time = [DateTime]$value[$i]
                } else {
                    $Result[$columns[$i]] = $value[$i]
                }
            }

            $ResultSeries.fields += $result
        }

        $ResultSeries
    }
}
Now that we have a function to retrieve data, let’s start creating components within our dashboard.
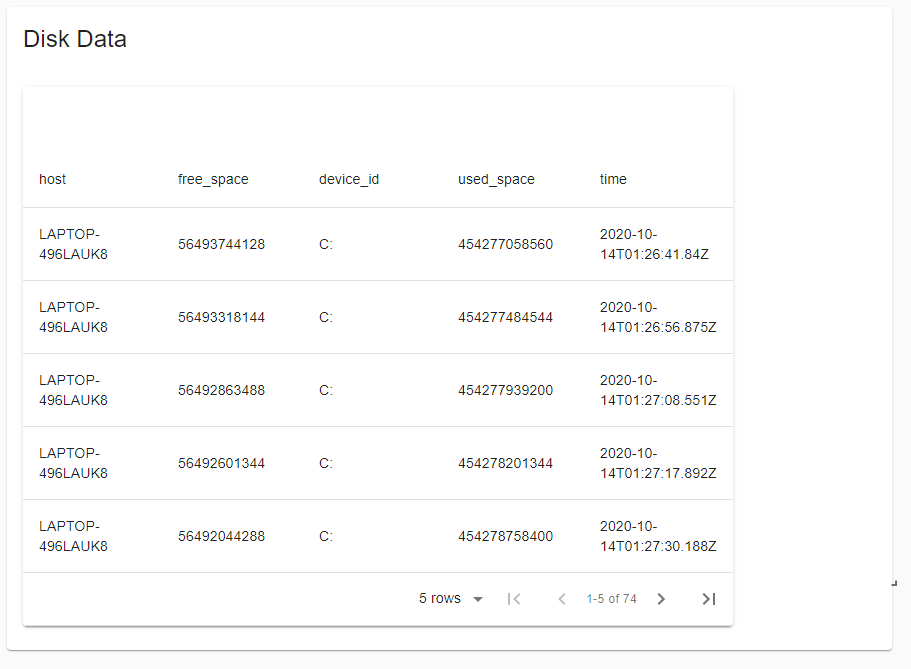
The disk table will contain a row for each measurement we take. This will include the host, drive letter, free space, used space and time stamp.
We select the last 60 minutes of measurements from InfluxDB. We will place the table within a UDElement that refreshes every 5 seconds to provide new data.
New-UDElement -Tag 'div' -AutoRefresh -RefreshInterval 5 -Endpoint {

    $Data = Get-InfluxDb -Query 'SELECT * FROM disk WHERE time > now() - 60m'

    New-UDTable -Data $Data.Fields
}
The resulting disk data table will look like this. You’ll be able to page, sort and filter the table.
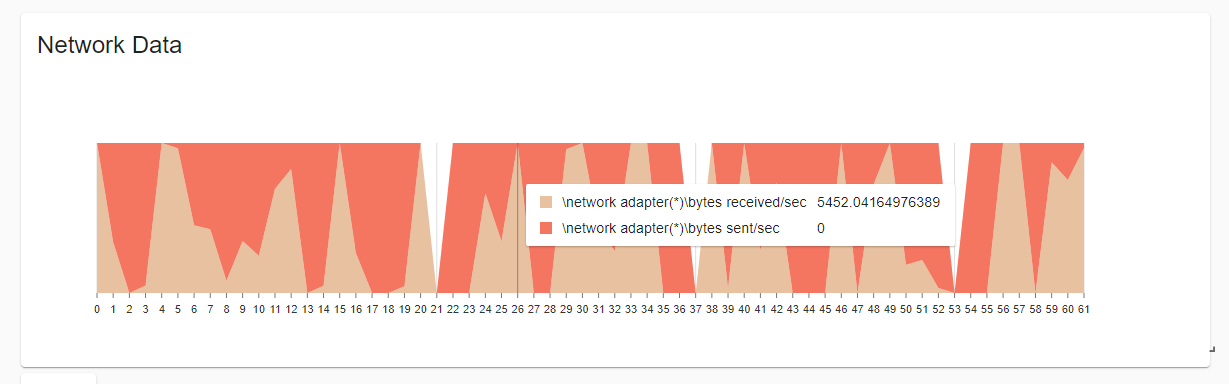
We will use the Nivo Stream chart to display the network utilization for our machine. This will include the bytes received and sent that we are storing within InfluxDB.
We will retrieve the last 10 minutes of data from InfluxDB from the network measurement. Next, we will format the data for use in the stream chart and pass it to New-UDNivoChart to produce the actual chart. We do this all within a New-UDElement that we will autorefresh every 5 seconds.
New-UDElement -Tag 'div' -Attributes @{ style = @{ width = "100%"; height = "100%" }}  -AutoRefresh -RefreshInterval 5 -Endpoint {

    $Data = Get-InfluxDb -Query 'SELECT * FROM network WHERE time > now() - 10m GROUP BY counter'

    $ChartData = for($i = 0; $i -lt $data[0].Fields.length; $i++) {
        $Point = @{}
        foreach($series in $data) {
            $Point[$series.counter] = $series.fields[$i].value
        }
        $Point
    }

    $NetworkStats = @(
        '\network adapter(*)\bytes received/sec'
        '\network adapter(*)\bytes sent/sec'
    )

    New-UDNivoChart -Height '250' -Stream -Data $ChartData -Id "networkData" -Responsive -MarginBottom 50 -MarginTop 50 -MarginRight 110 -MarginLeft 60 -Keys $NetworkStats -OffsetType expand -Curve linear
}
The resulting chart looks like this.
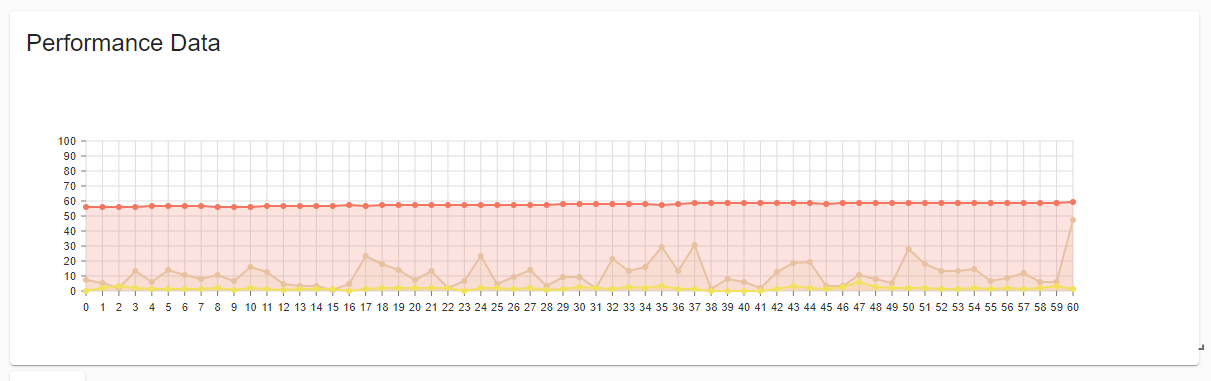
Finally, we will create a multi-series line chart that will contain the Disk, Memory and CPU usage percentages. We can again use Get-InfluxDB to retrieve data from our counter measurement, manipulate the data returned to fit that of the line chart and then output the line chart using New-UDNivoChart.
New-UDElement -Tag 'div' -Attributes @{ style = @{ width = "100%"; height = "100%" }} -AutoRefresh -RefreshInterval 5 -Endpoint {

    $Data = Get-InfluxDb -Query 'SELECT * FROM counter WHERE time > now() - 10m GROUP BY counter'

    $ChartData = @()


    foreach($series in $data) {

        $SeriesData = @{
            id =  $series.counter
            data = @()
        }

        $i = 0
        foreach($field in $Series.Fields) {
            $SeriesData.data += @{
                x = $i
                y = $field.value
            }
            $i++
        }

        $ChartData += $SeriesData
    }

    New-UDNivoChart -Height 250 -Data $ChartData -Id "performanceStats" -Line -Responsive -MarginBottom 50 -MarginTop 50 -MarginRight 110 -MarginLeft 60 -YScaleMax 100 -YScaleMin 0 -EnableArea
}
The resulting line chart looks like this.
Now that we have all our components outputting data, we can go back to the dashboard and layout them as we see fit. This will, again, copy the layout to our clipboard. Once the layout is set, you can pass the JSON to the -Layout parameter of New-UDGridLayout.
$Json = '{"lg":[{"w":12,"h":10,"x":0,"y":0,"i":"grid-element-networkData","moved":false,"static":false},{"w":12,"h":9,"x":0,"y":10,"i":"grid-element-performanceData","moved":false,"static":false},{"w":12,"h":14,"x":0,"y":19,"i":"grid-element-diskData","moved":false,"static":false}]}'

New-UDGridLayout -Content {
    # Components
} -Layout $Json
The final dashboard will look like this.
This blog post went over how to create a server performance monitoring dashboard with PowerShell Universal and InfluxDB. You can build a dashboard today for free.
Continue the conversion on the Ironman Software forums. Chat with over 1000 users about PowerShell, PowerShell Universal, and PowerShell Pro Tools.